ESP Query Composer Projections
This documentation references PopMedNet 2021.1 +
PopMedNet User's Guide
Based on version 2021.1 +
ESP Query Composer Projections and Adjustments
Background:
A custom query tool was developed within PMN that enables users at the Massachusetts Department of Public Health (MDPH) and providers to estimate disease prevalence. Users define a cohort of patients using complex inclusion and exclusion criteria. The system uses an external data set from the 2010 U.S. Census to generate three sets of stratified patient counts: observed patients, adjusted patient count, and projected patient count. This functionality helps to correct for skewed patient demographics among a network's data partners and provides estimated patient counts for locations not covered by the data partners. When the request is run by a data holder, two queries are executed: one to find the cohort of interest (observed patients) and another to produce a data set of the data partner's overall patient population demographics. These two data sets are then compared to Census data for a specified location to generate adjusted and projected patient counts. This PMN functionality was evaluated against results from the Behavioral Risk Factor Surveillance System (BRFSS) state and small-area estimates.
Quick Tips
The ESP Query Composer Projections and Adjustments functionality requires careful construction of the request and interpretation of the results.
- Ensure that the denominator of your request and the observed population results match by adding an additional criteria group in addition to the criteria groups that define your cohort of interest. This criteria group should include the following parameters:
- Minimum 1 visit
- Observation Period
- Start Date: Two years prior to your end date
- End Date: The end date for the observation period of your primary criteria group or, if no end date was defined for the primary criteria group, today's date.
- Select only one or more of the following stratification options:
- Age: 10 Year Age Group
- Sex
- Race-Ethnicity
- Zip Code
- If the Location or Custom Location terms are included in your request, you must select Zip Code as a stratification option to display the results by location.
- Projections will not work when Zip Codes are used to define the criteria. If you would like to select a group of specific Zip Codes or towns in MA, you must use the Custom Location Term
- When results are stratified by Location and/or Custom Location, each Location/Custom Location should be considered its own set of results with regard to census and calculated values.
Composing an ESP Query Composer Projections Request
The projections and adjustments functionality uses the same Query Composer request type to define a cohort of interest. See Query Composer Request for more information on how to define a cohort, however note that in order to generate interpretable adjusted and projected patient counts, there are some restrictions on possible request parameters. These restrictions and instructions are detailed below.
If the restrictions and instructions detailed below are not followed, then you may not be able to view adjusted and project patients counts or the counts may not be easily interpreted.
Terms
There are no restrictions on the terms that you may use in a criteria group. However, not all terms can be used as a stratification.
Criteria Groups
There are no restrictions on the number of criteria groups that you may use to define your cohort. However, if your request does not define an observation period or defines an observation period that is larger than two years, then an additional criteria group must be added to ensure that the denominator for your observed patients matches the denominator of the observed population.
If this criteria group is not added, then there will be a mismatch between the denominators which will affect the interpretability of your results and could produce an outcome where the observed patient count is larger than the observed population count for a strata. See the diagram to to the right for a visual explanation of why this is necessary.

This additional criteria group should be defined as:
- Minimum 1 visit
- Observation Period
- Start Date: Two years prior to your end date
- End Date: The end date for the observation period of your primary criteria group or, if no end date was defined for the primary criteria group, today's date.
In the example to the right, the observation period in the primary criteria group is 01/01/2008 - 01/01/2012. Because this observation period is larger than two years, the additional criteria group is necessary. It is defined as minimum one visit, 01/01/2010 - 01/01/2012.

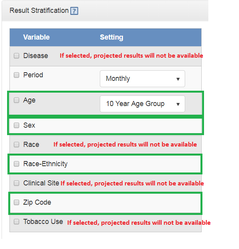
Result Stratification
Any combination of the following stratification options are permitted. You may also choose not to stratify the results, in which case a single count will be returned.
| Stratification Option | Notes |
|---|---|
| Age: 10 Year Age Group | |
| Sex | |
| Race-Ethnicity | See below for how race-ethnicity is defined |
| Zip Code | If the Location or Custom Location terms are used, this must be selected as a stratification option to ensure that the results are stratified by location. Individual and Aggregate Results views will display results stratified by zip code. The Projected Results view will display results stratified by location. |
If any stratification options other than these are selected, you will not be able to view the adjusted and projected counts of the results.
Viewing Results
View the results of a request from the Request Detail page by selecting the DataMarts to view in the Received Responses panel and clicking View Results. Click Projected View to view the adjusted and projected patient counts. One or more tabs will appear in the results view, as described below.
In addition to the stratification options selected (Ten Year Age Group, Sex, and/or Race-Ethnicity), the following columns are displayed in the results table for both tabs:

| Patient Counts | Description | Calculation |
|---|---|---|
| Observed Patients | Raw count of patients with selected outcomes in the source DataMarts | None |
| Observed Population | Count of patients from the location(s) of interest with at least one visit of any kind in the two years prior to the end of the observation period of interest. If no observation period end date is defined, then this data set includes patients with at least one visit of any kind in the two years prior to the date that the request is executed by the data partner. | None |
| Observed Population % | Percentage of the population from the source DataMarts in the strata | (Observed population strata / Σ(Observed population strata))*100 |
| Census Population | Count of people from the specified location of interested from the 2010 census. | N/A |
| Census Population % | Percentage of the census population in the strata | (Census population strata / Σ(Census population strata ))*100 |
| Adjusted Patient Count | Adjusted count of patients with selected outcomes in the source DataMarts after taking into account differences in the age, sex, and/or race-ethnicity distribution in the DataMart population compared to the census population in the region of interest | Observed patient strata * (census population % strata / observed population % strata) |
| Projected Patient Count | Projected number of patients with the outcome in the specified region of interest, after taking into account the census population demographics for the region of the interest | Observed patient strata * (census population strata / observed population strata) |
This view will only be available if the Location or Custom Location term was included in the request and Zip Code was selected as a stratification option.
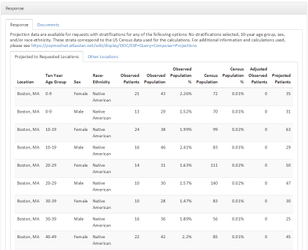
The results table will be displayed in the Response panel of the results page. Use the dropdown menus at the top right to switch census values and projected and adjusted counts between states, regions, and towns of interest. When a new location is selected, the values in the Census Population, Census Population %, Adjusted Observed Patients, and Projected Patients columns will populate with new values based off of the census data for the location.
The census values between the Project to Requested Locations and Other Locations tab are based on slightly different data. Census values for a location may not match across the results sets.
Projected Locations Census data: When the projections functionality was first developed, the groups of zip codes are considered a town or region based off of this spreadsheet provided by MDPH
Other Locations 2010 Census data: The Census data used are from the 2010 Census Summary File 1 which is a data set organized by “ZCTA” or Zip Code Tabulation Areas. Specifically, starting at page 381, the tables PCT12H --> PCT12M were used. PCT12N and PCT12O. were not used as these data were not included in the Census data used for the Projected Locations calculations. ZCTAs were created by the United States Census Bureau to provide a ZIP Code like unit of aggregation. For example, if there are ~750 zip codes that USPS recognizes in MA – there are only ~550 ZCTAs that the census creates from them. The Census Bureau simplifies the geographic boundaries and drops many of the corporate and non-area zip codes.


Additional Information
Race-Ethnicity Definitions
In order to produce data sets that could be compared to census data, the following mappings were created to map ESP Race and Hispanic values to ESP: MDPHnet Race-Ethnicity values. Additionally, when viewing projected results, ESP: MDPHnet Race-Ethnicity values are mapped to census values. These mappings are described below. The ESP: MDPHnet Race-Ethnicity mappings are displayed when viewing results.
ESP Race and Hispanic Mappings to ESP: MDPHnet Race-Ethnicity
| ESP Race Values | ESP Hispanic Values | ESP: MDPHnet Race-Ethnicity |
|---|---|---|
| White | Yes | Hispanic |
| White | No | White |
| White | Missing / null | White |
| White | Unknown | White |
| Black or African American | Yes | Hispanic |
| Black or African American | No | Black |
| Black or African American | Missing / null | Black |
| Black or African American | Unknown | Black |
| Asian | Yes | Hispanic |
| Asian | No | Asian |
| Asian | Missing / null | Asian |
| Asian | Unknown | Asian |
| American Indian or Alaska Native | Yes | Hispanic |
| American Indian or Alaska Native | No | American Indian or Alaska Native |
| American Indian or Alaska Native | Missing / null | American Indian or Alaska Native |
| American Indian or Alaska Native | Unknown | American Indian or Alaska Native |
| Native Hawaiian or Other Pacific Islander | Yes | Hispanic |
| Native Hawaiian or Other Pacific Islander | No | Asian |
| Native Hawaiian or Other Pacific Islander | Missing / null | Asian |
| Native Hawaiian or Other Pacific Islander | Unknown | Asian |
| Unknown | Yes | Hispanic |
| Unknown | No | Unknown |
| Unknown | Missing / null | Unknown |
| Unknown | Unknown | Unknown |
ESP: MDPHnet Mappings to Census Values
| ESP: MDPHnet Race-Ethnicity | Census Values |
|---|---|
| White | NHW = White, non-Hispanic |
| Black | NHB = Black, non-Hispanic |
| Asian | NHAP = Asian Pacific Islander, non-Hispanic |
| American Indian or Alaska Native | NHAI = American Indian, non-Hispanic |
| Hispanic | HISP = Hispanic |
| Unknown | No mapping available |