Data Checker Requests v5.0

This documentation references PopMedNet 5.0 +

For version 4.0.3 documentation, please see PopMedNet User's Guide Version 4.0.3

PopMedNet User's Guide

Based on version 5.0


Data Checker Requests

The PopMedNet software supports querying against the Data Characterization data model. The Data Characterization tables are created from data quality review and characterization output. The tables contain information regarding the distribution and missingness of variables among the data held by each data partner.

Data Checker requests allow you to query the Data Characterization data model and generate tables and charts of the results. You may select which data partners to include in the request. 

There are nine Data Checker request types. The sections below describe the general instructions for composing Data Checker requests and viewing results and the details of each request type and its specific parameters.


Request TypeDescription
Demographic: Ethnicity Ethnicity distribution among, within, and contributed by selected data partners
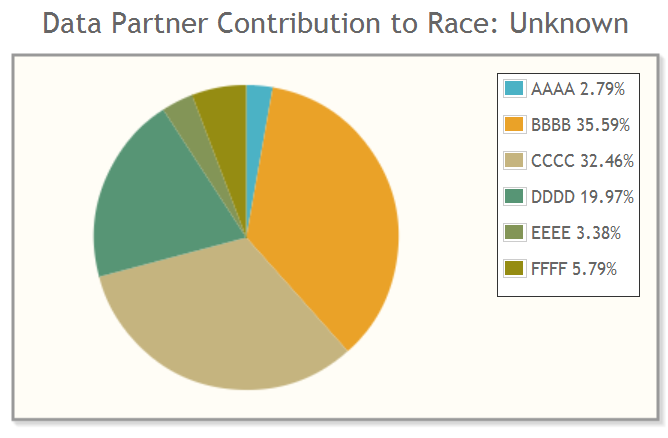
Demographic: RaceRace distribution among, within, and contributed by selected data partners
Diagnosis: Diagnosis CodesCount and distribution of specified diagnosis codes among, within, and contributed by the selected data partners. May be filtered by diagnosis code type
Diagnosis: PDXDistribution of discharge diagnosis types by encounter type among and within selected data partners

Dispensing: NDC

Presence of specified National Drug Codes at the selected data partners
Dispensing: RxAmtDistribution of pharmacy dispensing amount supply among, within, and contributed by selected data partners
Dispensing: RxSupDistribution of pharmacy dispensing days supply among, within, and contributed by selected data partners
Metadata: Data CompletenessCompleteness and availability of data by table and data partner
Procedure: Procedure CodesCount and distribution of specified procedure codes among, within, and contributed by the selected data partners. May be filtered by procedure code type.

General Instructions

Composing a Data Checker request

  1. From the Requests page, select your project and click New Request at the bottom of the request panel.
  2. Select the Data Checker request model and then the request type to open the Request Composer page.
  3. Enter the request metadata.
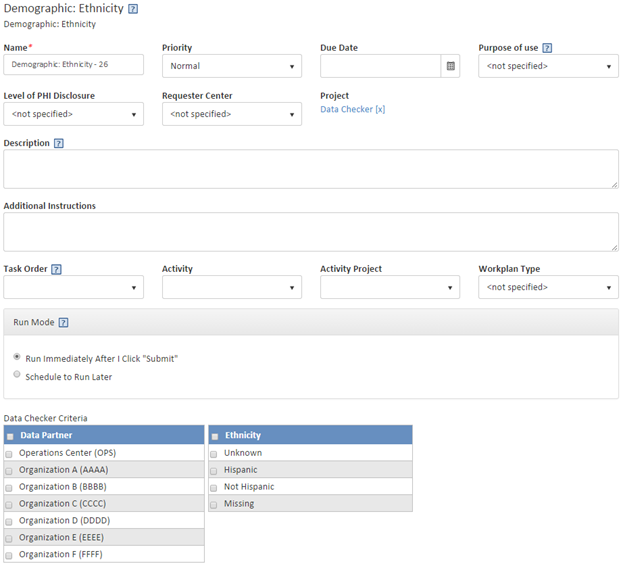
  4. Select the request parameters in the Data Checker Criteria panel
    1. Use the checkboxes to select the data partners of interest. 

      This list of data partners is dynamically generated based on the organizations that own the DataMarts connected to the project. Therefore there may be data partners present in the list that are not contained in the database. However, if a data partner is selected and they are not present in the database, they will not appear in or affect the results. The acronym associated with each data partner on their Organization profile must match the acronym used in the database to be queried.

    2. Depending on the request type, use the checkboxes to select the variable(s)of interest or enter codes of interest in the text box. See below for more details on request type specific criteria.
  5. In the DataMart routing panel, select the DataMart and click Submit.


Data Checker Request Composition Page

 Viewing the results of a Data Checker request

  1. Review the status of the request from the Request panel on your homepage or the Requests page. Click on the name of the request to open the Request Details page.
  2. In the DataMart Routing panel, click View Results.
  3. On the Results page, the results will appear in the Response panel. Use the dropdown menu at the top right of the Response panel to switch between different result views. See below for more details on the request type specific result views available. 
  4. Click the  icon next to the dropdown menu to open the results in a new window for easier viewing.
  5. To download the raw data for the request, click the Download button in the Request panel.

    The tables and charts in the Response panel are dynamically generated and not currently exportable. They are designed so that users may take a screenshot of them for use outside of the Portal and that all necessary information to contextualize the charts will be present in the screenshot. The Snipping Tool, included in Windows 7 and later Windows operating systems, is a useful application for taking screenshots.


Data Checker Results - Overall Metrics Result View

Data Checker Results - Overall Metrics Result View in a New Window


Data Checker Request Types


Demographic: Ethnicity

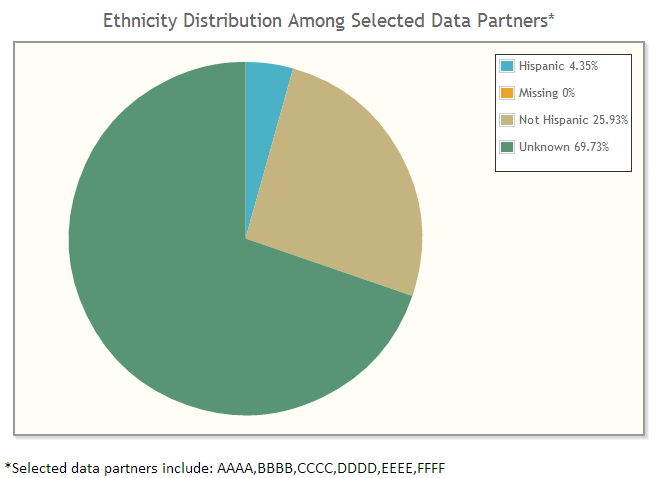
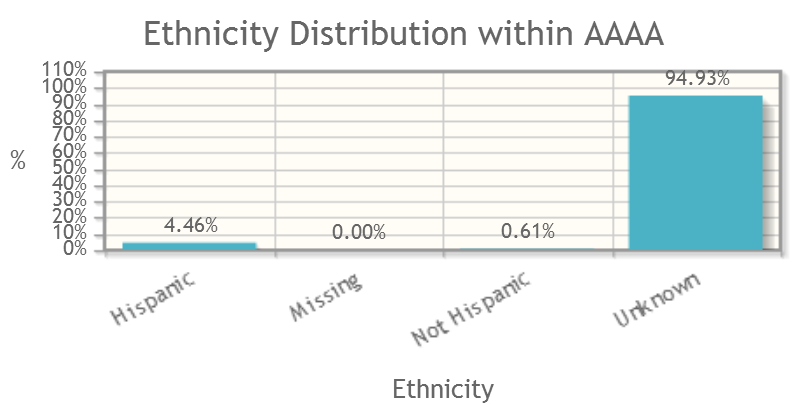
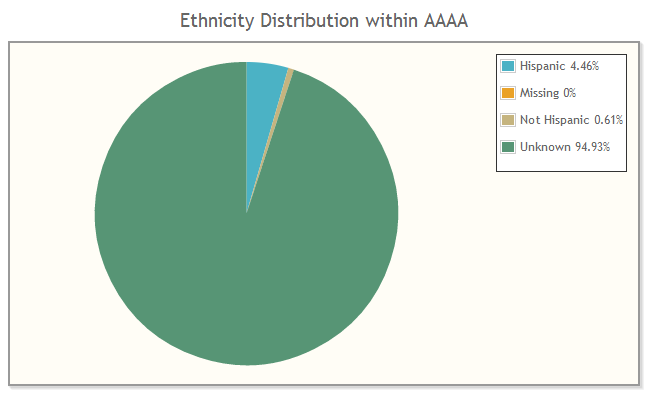
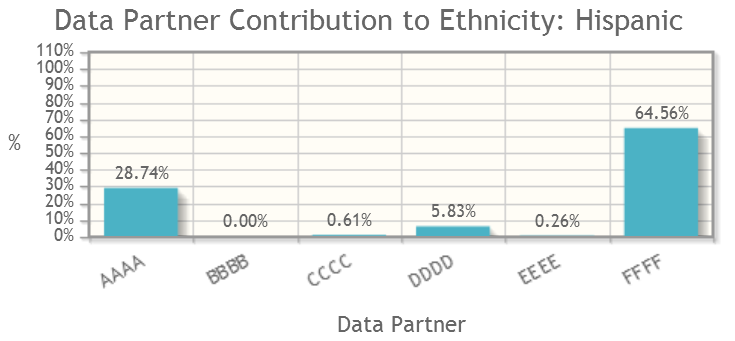
The Demographic: Ethnicity Data Checker request queries for the ethnicity distribution among, within, and contributed by the selected data partners.

Request Parameters

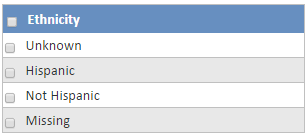
  1. Use the checkboxes to select the Ethnicity variable(s) of interest. Options include:

    • Unknown
    • Hispanic
    • Not Hispanic
    • Missing

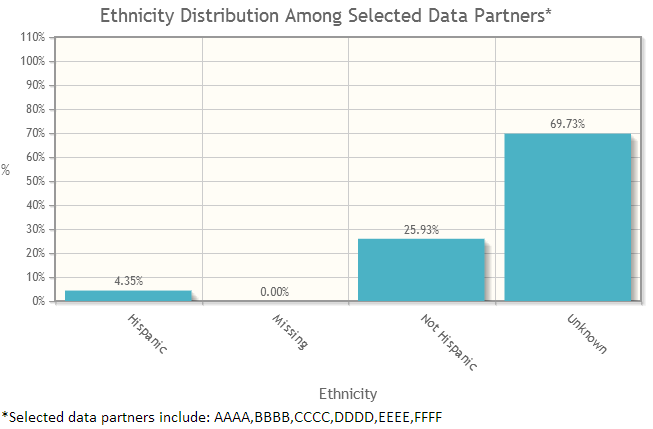
If fewer than all of the variables are selected, then the values of the unselected variables are summed into an "Other" category for comparison purposes. For example, if "Hispanic" and "Not Hispanic" are selected, the values for "Unknown" and "Missing" will be summed in an "Other" category.


Ethnicity Variable Selector

Result Views

Three result views are available for the Demographic: Ethnicity request. Expand the sections below for details on each view and samples of the tables and charts available. 
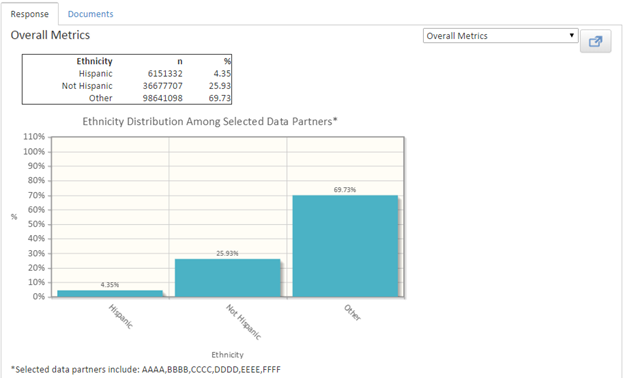
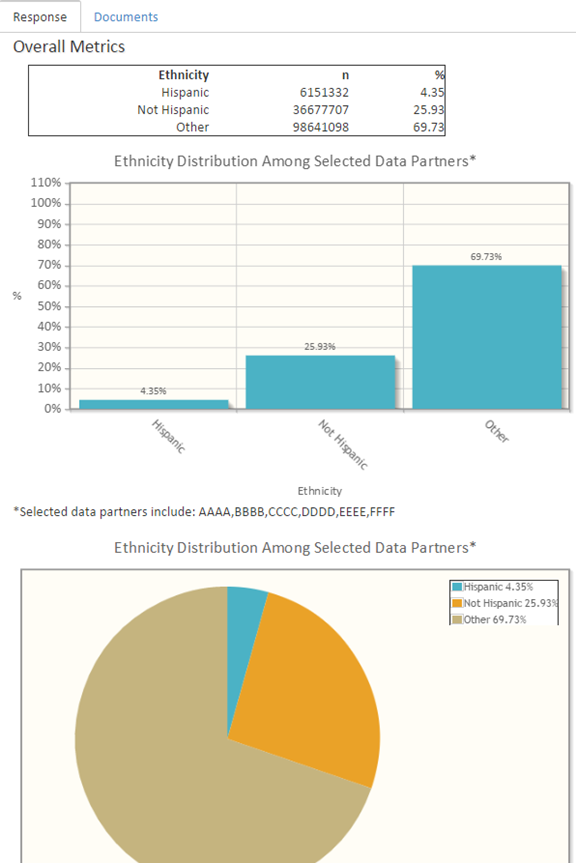
 Overall Metrics

Calculation: the sum and percent distribution of the selected variables among the selected data partners

Sample table:

Sample bar chart:

Sample pie chart:


 Percent within Data Partner

 Calculation: the sum and percent distribution of the selected variables within the selected data partners. Percentages calculated across columns.

Sample table:

Sample bar chart:

Sample pie chart:

 Data Partner Contribution

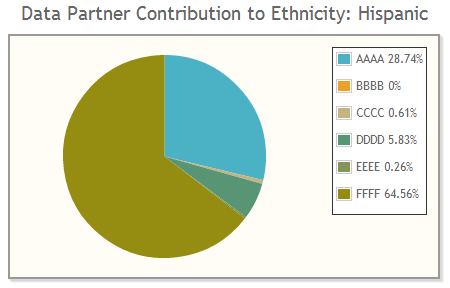
 Calculation: the sum and percent contributed by the selected data partners to the selected variables. Percentages calculated across rows.

Sample table:

Sample bar chart:

Sample pie chart:


Demographic: Race

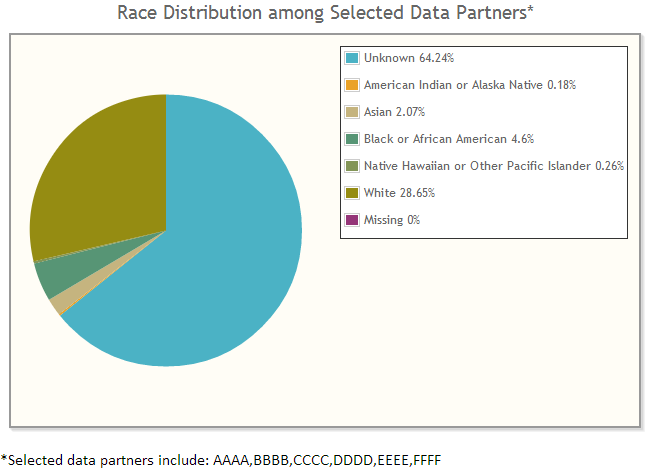
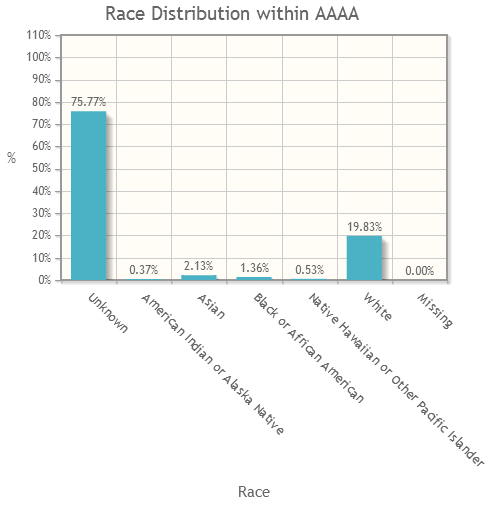
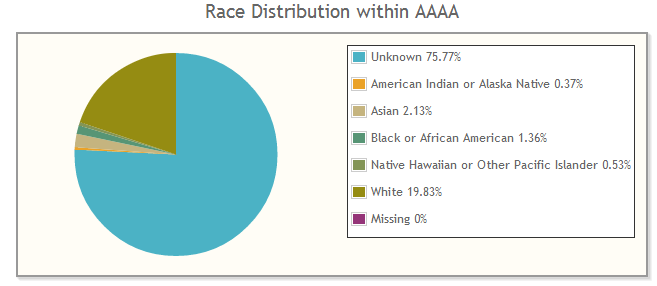
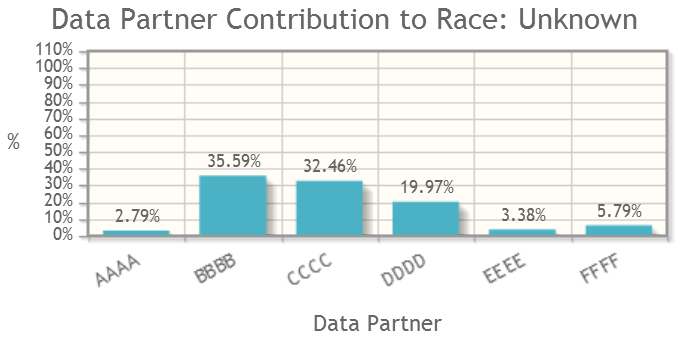
The Demographic: Race Data Checker request queries for the race distribution among, within, and contributed by the selected data partners.

Request Parameters

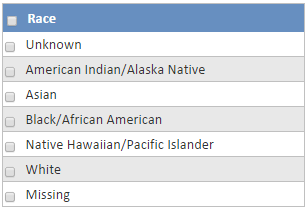
  1. Use the checkboxes to select the Race variable(s) of interest. Options include:
    • Unknown
    • American Indian/Alaska Native
    • Asian
    • Black/African American
    • Native Hawaiian/Pacific Islander
    • White
    • Missing

If fewer than all of the variables are selected, then the values of the unselected variables are summed into an "Other" category for comparison purposes. For example, if "Unknown" and "Missing" are selected, the values for the other categories will be summed in an "Other" category.


Race Variable Selector

Result Views

Three result views are available for the Demographic: Race request. Expand the sections below for details on each view and samples of the tables and charts available. 

 Overall Metrics

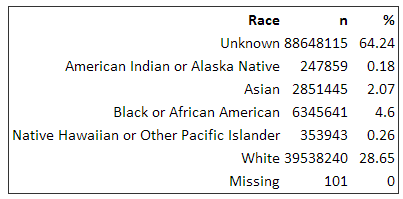
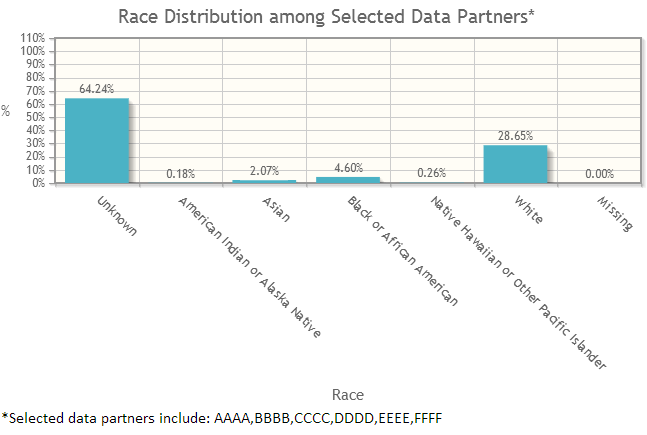
Calculation: the sum and percent distribution of the selected variables among the selected data partners.

Sample table:

Sample bar chart:

Sample pie chart:

 Percent within Data Partner

Calculation: the sum and percent distribution of the selected variables within the selected data partners. Percentages calculated across columns.

Sample table:

Sample bar chart:

Sample pie chart:

 Data Partner Contribution

 Calculation: the sum and percent contributed by the selected data partners to the selected variables. Percentages calculated across rows.

Sample table:

Sample bar chart:

Sample pie chart:


Diagnosis: Diagnosis Codes

 The Diagnosis: Diagnosis Codes Data Checker request queries counts and distribution of codes among, within, and contributed by the selected data partners.

Request Parameters

  1. Select the code type from the dropdown menu. Options include:
    • ICD-9-CM
    • ICD-10-CM
    • ICD-11-CM
    • SNOMED CT
    • Other
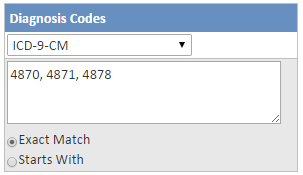
  2. Enter comma separated codes, without decimal points, in the textbox. For example, enter 4870, not 487.0.
  3. Select whether the query should look an exact match of the codes or whether it should return codes that start with the code(s) entered.


Diagnosis Code Variable Selector


Result Views

Three result views are available for the Diagnosis: Diagnosis Codes request. Expand the sections below for details on each view and samples of the tables and charts available. 
 Overall Metrics

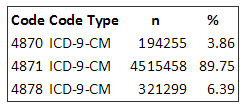
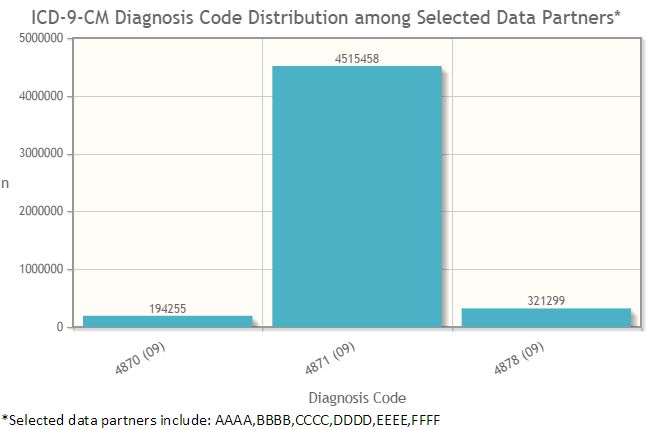
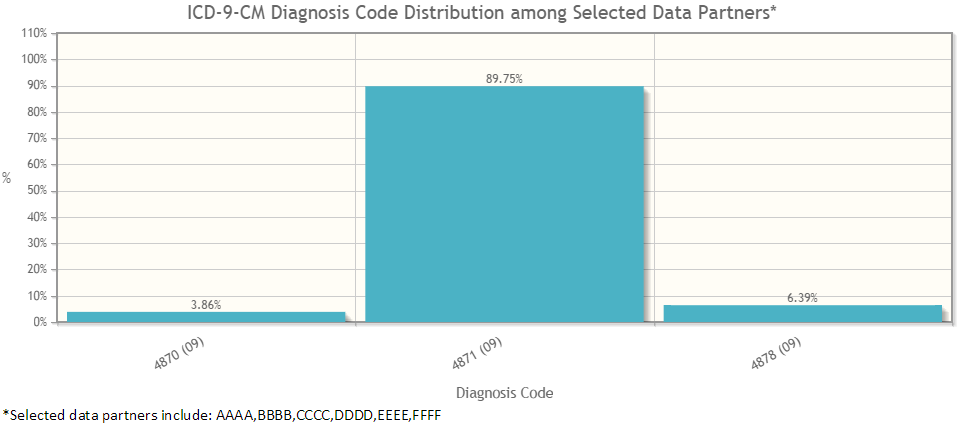
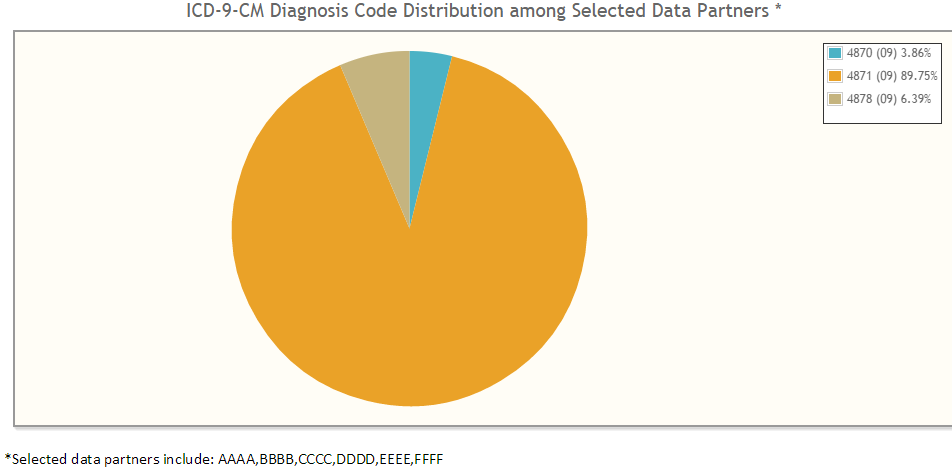
 Calculation: the sum and percent distribution of the selected codes among the selected data partners

Sample table:

Sample bar chart (counts):

Sample bar chart (percentages):

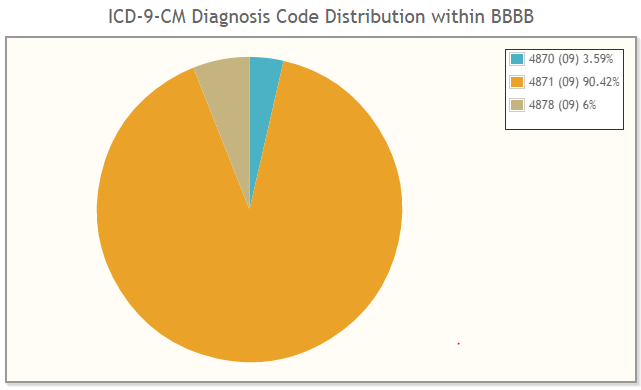
Sample pie chart:

 Count by Data Partner

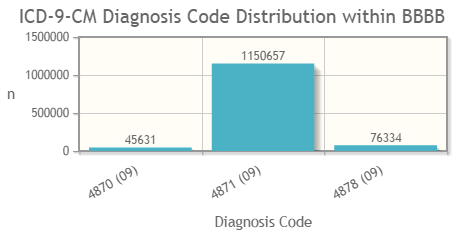
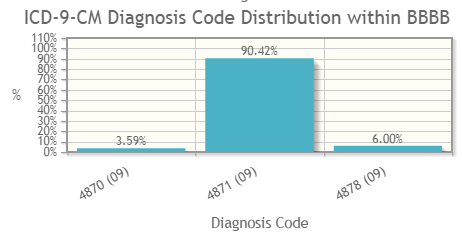
Calculation: the sum and percent distribution of the selected codes within the selected data partners. Percentages calculated across columns.

Sample table:

Sample bar chart (counts):

Sample bar chart (percentages):

Sample pie chart


 Data Partner Contribution

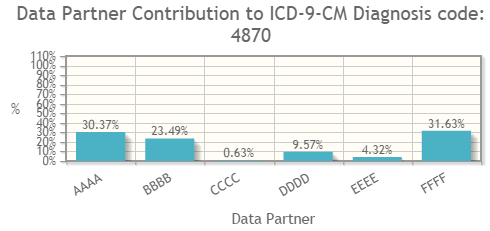
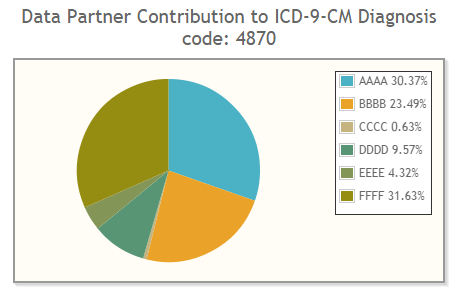
 Calculation: the sum and percent contributed by the selected data partners to the selected codes. Percentages calculated across rows.

Sample table:

Sample bar chart:

Sample pie chart:


Diagnosis: PDX

The Diagnosis: PDX Data Checker request queries for the distribution of discharge diagnosis types by encounter type among and within selected data partners.

Request Parameters

  1. Use the checkboxes to select the PDX variable(s) of interest. Options include:
    • Principle
    • Secondary
    • Other PDX
    • Missing
  2. Use the checkboxes to select the Encounter Type(s) of interest. Options include:
    • All
    • Ambulatory Visit (AV)
    • Emergency Department (ED)
    • Inpatient Hospital Stay (IP)
    • Non-Acute Institutional Stay (IS)
    • Other Ambulatory Visit (OA)
    • Missing

If fewer than all of the variables are selected, then the values of the unselected variables are summed into an "OTHER" category (captialized to distinguish it from "Other PDX") for comparison purposes. For example, if "Principle" and "Secondary" are selected, the values for "Other PDX" and "Missing" will be summed in an "OTHER" category.


PDX and Encounter Type Selectors

Result Views

Two result views are available for the Diagnosis: PDX request. Expand the sections below for details on each view and samples of the tables and charts available. 
 Overall Metrics

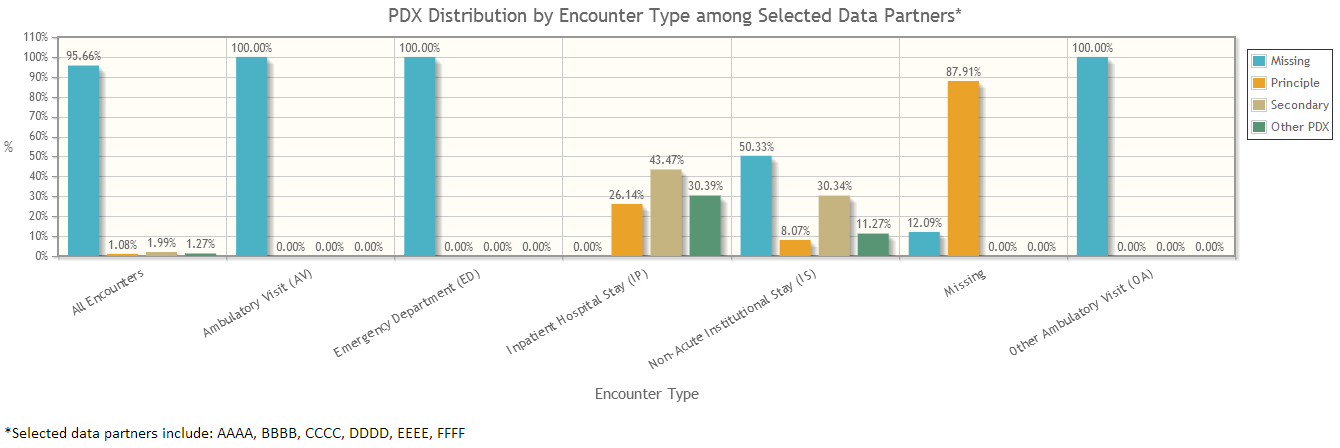
 Calculation: the sum and percent distribution by Encounter Type of the selected PDX variables among the selected data partners. Percentages calculated across columns.

Sample table:

Sample bar chart:

 Percent within Data Partner

Calculation: the sum and percent distribution by Encounter Type of the selected PDX variables within the selected data partners. Percentages calculated across columns.

Sample table:

Sample bar chart:


Dispensing: NDC 

The Dispensing: NDC Data Checker request queries for the presence of specified National Drug Codes at the selected data partners.

Request Parameters

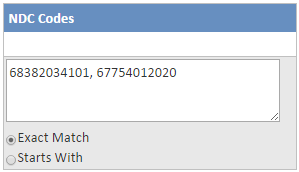
  1. Enter comma separated codes in the textbox.
  2. Select whether the query should look an exact match of the codes or whether it should return codes that start with the code(s) entered.


NDC Code Selector

Result Views

One result view is available for the Demographic: Ethnicity request. Expand the section below for details on this view and a samples of the table available. 

 Presence by Data Partner

Calculation: if the code is present at the selected data partner, the cell is marked with a 1. If the code is not present, the cell is marked with a 0. The final column provides a count of the data partners at which the code is present.

Sample table:


Dispensing: RxAmt

The Dispensing: RxAmt Data Checker request queries for the distribution of pharmacy dispensing amount supply among, within, and contributed by selected data partners.

Request Parameters

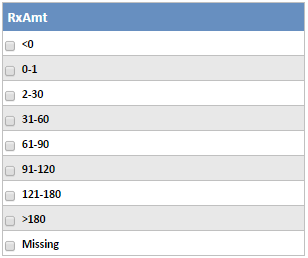
  1. Use the checkboxes to select the RxAmt range(s) of interest. Options include:
    • <0
    • 0-1
    • 2-30
    • 31-60
    • 61-90
    • 91-120
    • 121-180
    • >180
    • Other RxAmt
    • Missing

If fewer than all of the variables are selected, then the values of the unselected variables are summed into the "Other RxAmt" category for comparison purposes. For example, if "0-1", "2-30", and "31-60" are selected, the values for the other categories will be summed in the "Other RxAmt" category. Note that the "Other RxAmt" category will be included regardless of whether it was selected as a request parameter.


RxAmt Code Selector

Result Views

Three result views are available for the Dispensing: RxAmt request. Expand the sections below for details on each view and samples of the tables and charts available. 
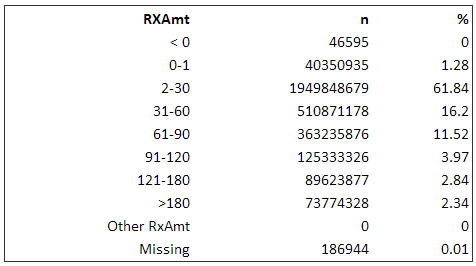
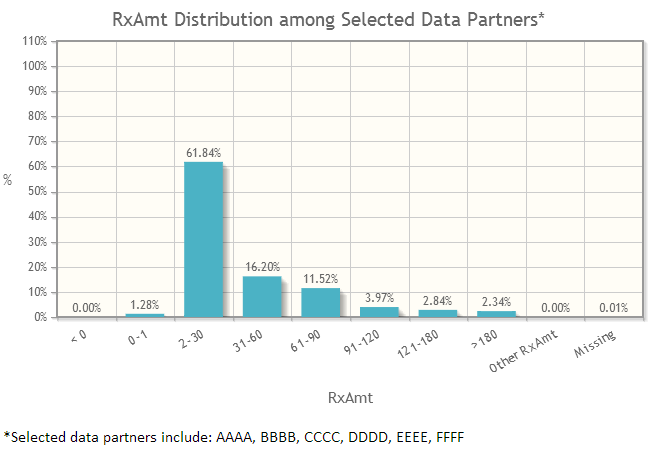
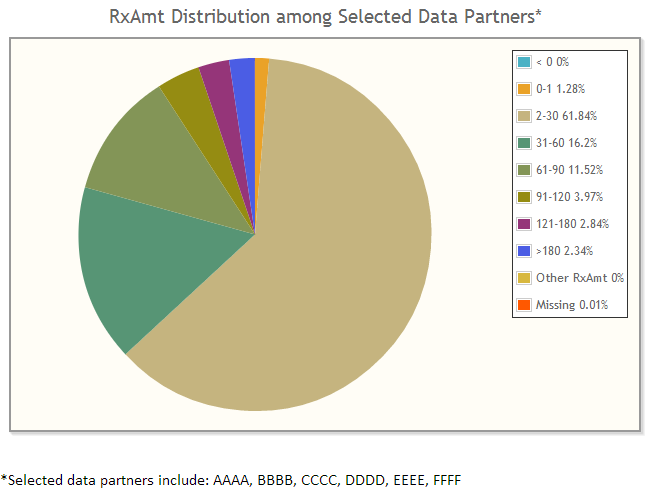
 Overall Metrics

Calculation: the sum and percent distribution of the selected RxAmt ranges among the selected data partners.

Sample table:

Sample bar chart:

Sample pie chart:

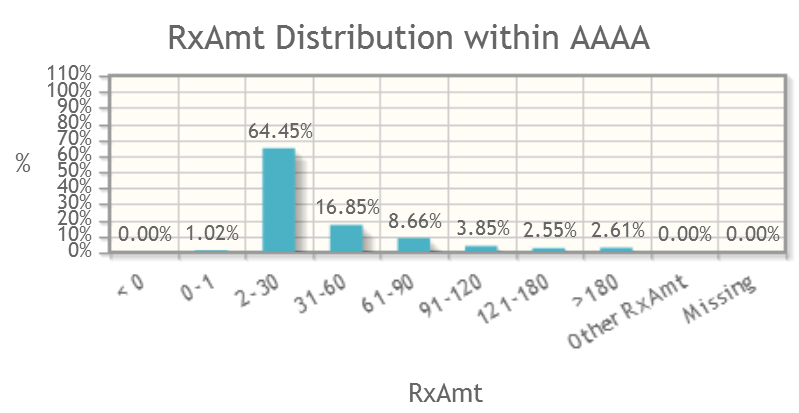
 Percent within Data Partner

Calculation: the sum and percent distribution of the selected RxAmt ranges within the selected data partners. Percentages calculated across columns.

Sample table:

Sample bar chart:

Sample pie chart:

 Data Partner Contribution

Calculation: the sum and percent contributed by the selected data partners to the selected RxAmt ranges. Percentages calculated across rows.

Sample table:

Sample bar chart:

Sample pie chart:


Dispensing: RxSup

The Dispensing: RxSup Data Checker request queries for the distribution of pharmacy dispensing days supply among, within, and contributed by selected data partners.

Request Parameters

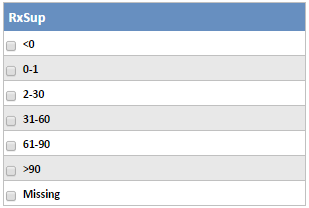
  1. Use the checkboxes to select the RxSup range(s) of interest. Options include:
    • <0
    • 0-1
    • 2-30
    • 31-60
    • 61-90
    • >90
    • 121-180
    • >180
    • Other RxSup
    • Missing

If fewer than all of the variables are selected, then the values of the unselected variables are summed into the "Other RxSup" category for comparison purposes. For example, if "0-1", "2-30", and "31-60" are selected, the values for the other categories will be summed in the "Other RxSup" category. Note that the "Other RxSup" category will be included regardless of whether it was selected as a request parameter.


RxSup Code Selector

Result Views

Three result views are available for the Dispensing: RxSup request. Expand the sections below for details on each view and samples of the tables and charts available. 

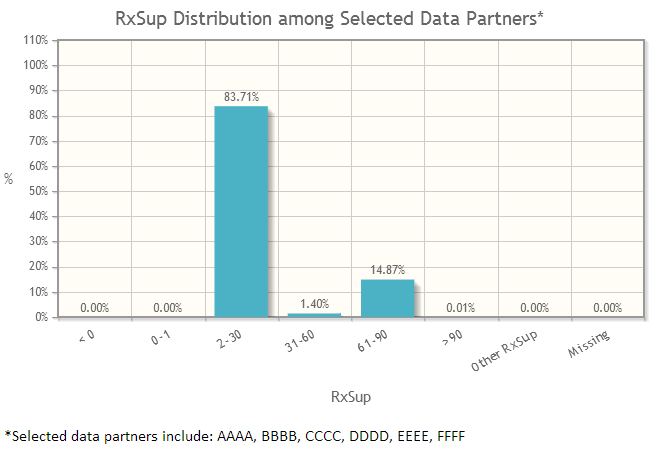
 Overall Metrics

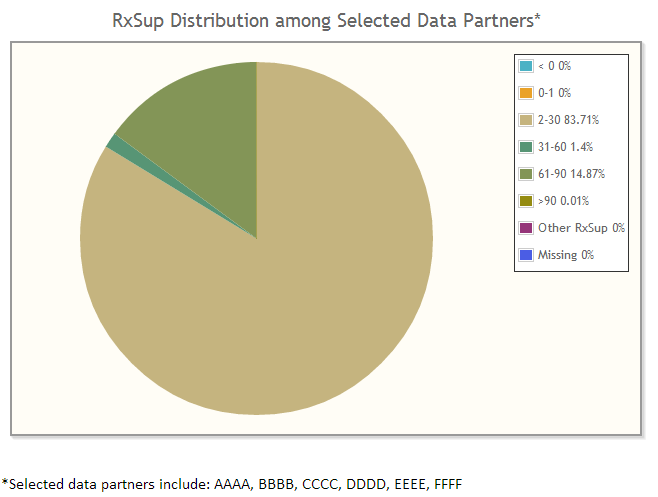
Calculation: the sum and percent distribution of the selected RxSup ranges among the selected data partners.

Sample table:

Sample bar chart:

Sample pie chart:

 Percent within Data Partner

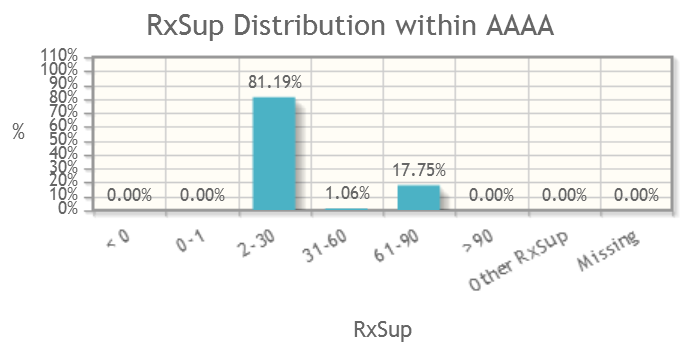
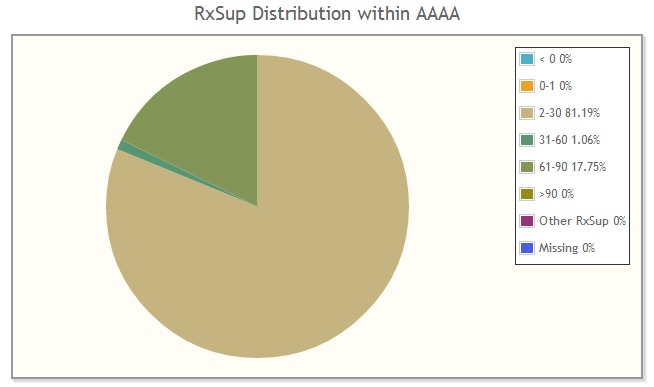
Calculation: the sum and percent distribution of the selected RxSup ranges within the selected data partners. Percentages calculated across columns.

Sample table:
Sample bar chart:
Sample pie chart: 
 Data Partner Contribution

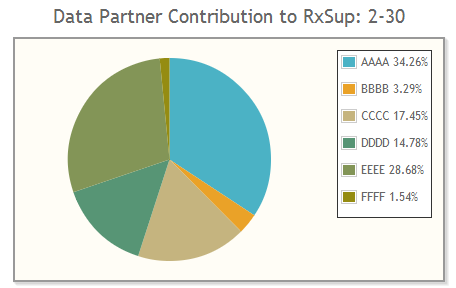
Calculation: the sum and percent contributed by the selected data partners to the selected RxSup ranges. Percentages calculated across rows.

Sample table:

Sample bar chart:

Sample pie chart:


Metadata: Data Completeness

The Metadata: Data Completeness Data Checker request queries for the completeness and availability of data by table and data partner.

Request Parameters

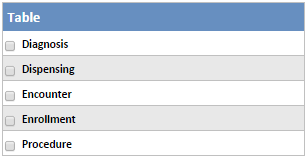
  1. Use the checkboxes to select the table(s) of interest. Options include:
    • Diagnosis
    • Dispensing
    • Encounter
    • Enrollment
    • Procedure


Table Code Selector

Result Views

One result view is available for the Metadata: Data Completeness request. Expand the sections below for details on this view and a samples of the table available. 

 Click here to expand...

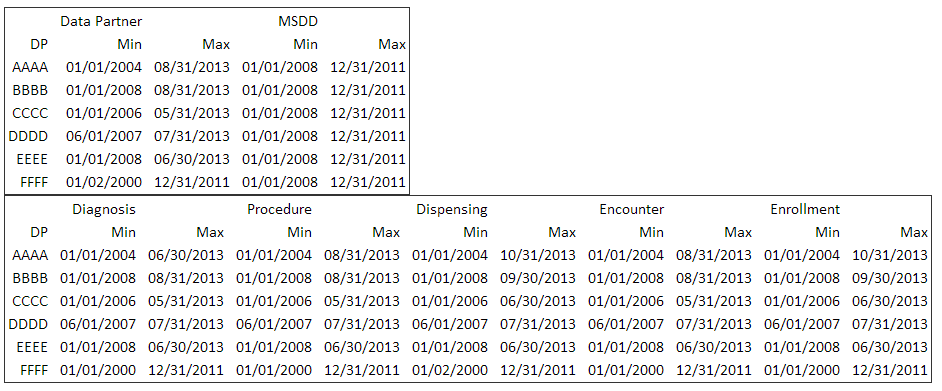
Calculation: the start and end date of each table in the select data partner's database. Also includes the minimum and maximum dates of the data partner's data across all tables and the minimum and maximum dates across the entire distributed database.

Sample table:


Procedure: Procedure Codes

 The Procedure: Procedure Codes Data Checker request queries counts and distribution of codes among, within, and contributed by the selected data partners.

Request Parameters

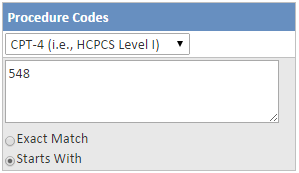
  1. Select the code type from the dropdown menu. Options include:
    • ICD-9-CM
    • ICD-10-CM
    • ICD-11-CM
    • CPT Category II
    • CPT Category III
    • CPT-4 (i.e., HCPCS Level I)
    • HCPCS (i.e., HCPCS Level II)
    • HCPCS Level III
    • LOINC
    • Local Homegrown
    • NDC
    • Revenue
    • Other
  2. Enter comma separated codes, without decimal points, in the textbox.
  3. Select whether the query should look an exact match of the codes or whether it should return codes that start with the code(s) entered.


Procedure Code Selector

Result Views

Three result views are available for the Procedure: Procedure Codes request. Expand the sections below for details on each view and samples of the tables and charts available. 
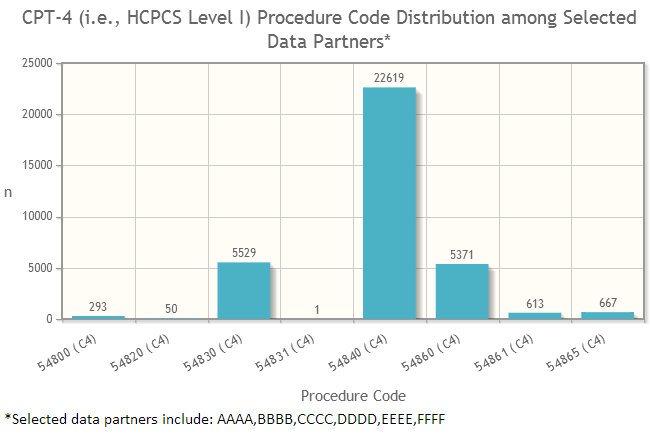
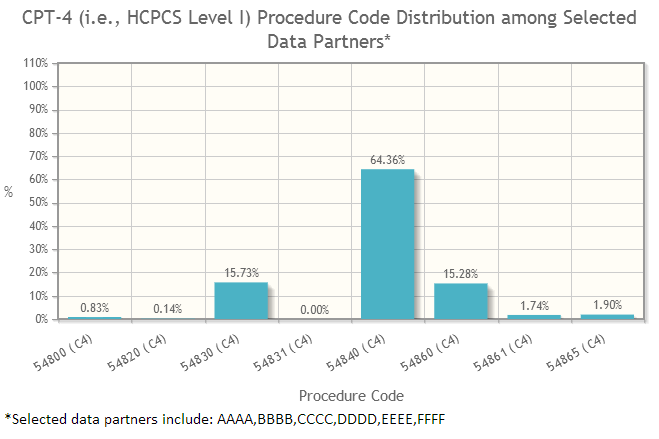
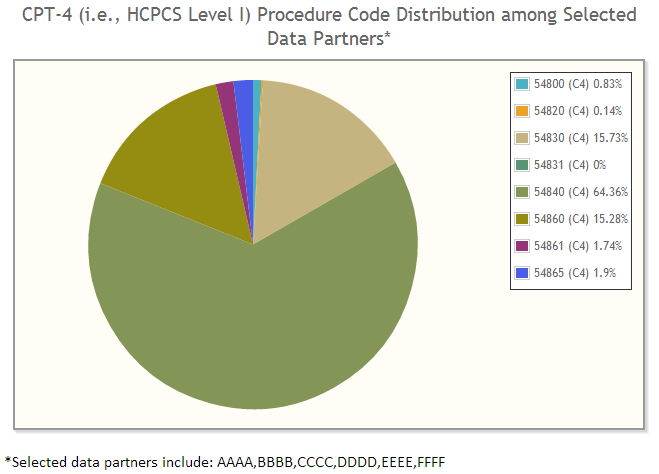
 Overall Metrics

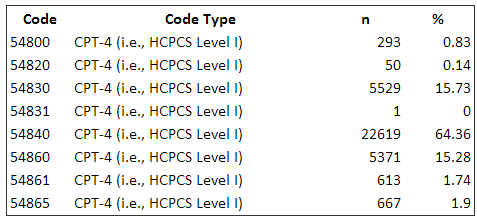
Calculation: the sum and percent distribution of the selected codes among the selected data partners

Sample table:

Sample bar chart (counts):

Sample bar chart (percentages):

Sample pie chart:

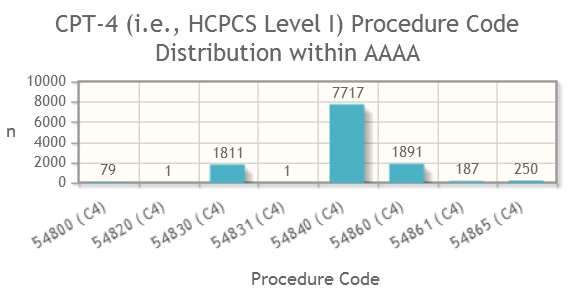
 Count by Data Partner

Calculation: the sum and percent distribution of the selected codes within the selected data partners. Percentages calculated across columns.

Sample table:

Sample bar chart (counts):

Sample bar chart (percentages):

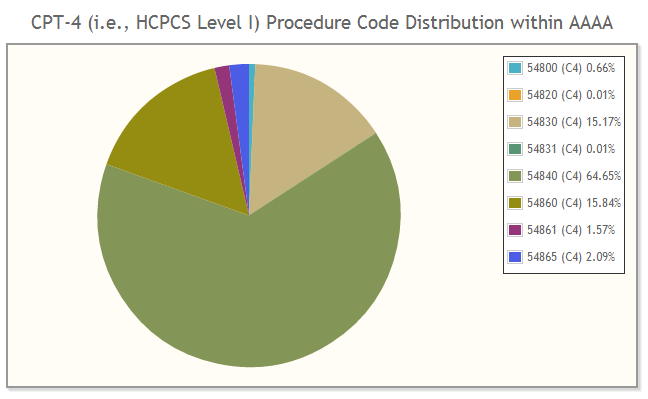
Sample pie chart:

 Data Partner Contribution

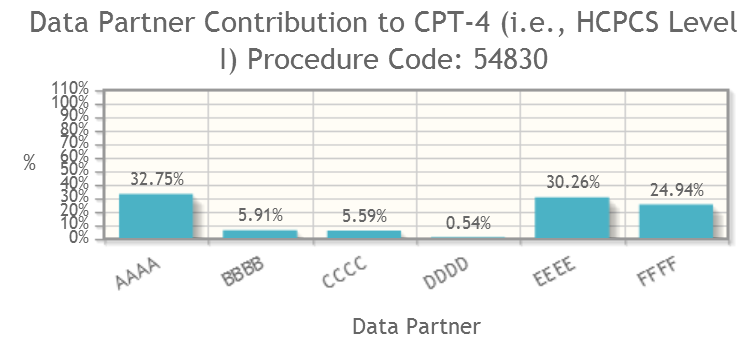
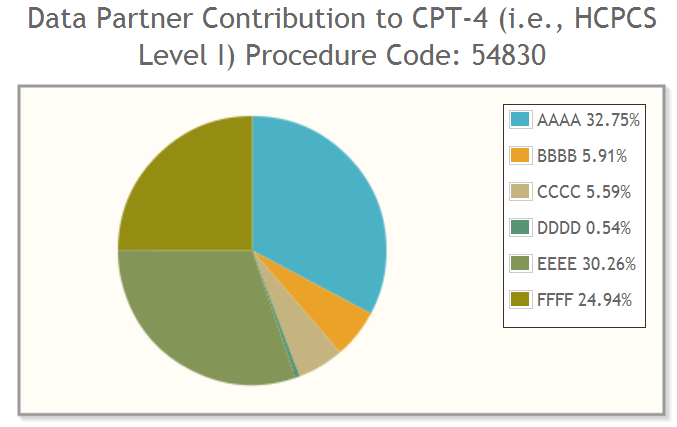
Calculation: the sum and percent contributed by the selected data partners to the selected codes. Percentages calculated across rows.

Sample table:

Sample bar chart:

Sample pie chart: 


Contact Us

PopMedNet Service Desk